Introduction
As a Revenue Assurance Analyst, I recently embarked on a project to test the limits of Power BI in creating an intuitive receivable management dashboard. This project was an exercise to see how far I could push Power BI's capabilities in designing a comprehensive dashboard.
Objective
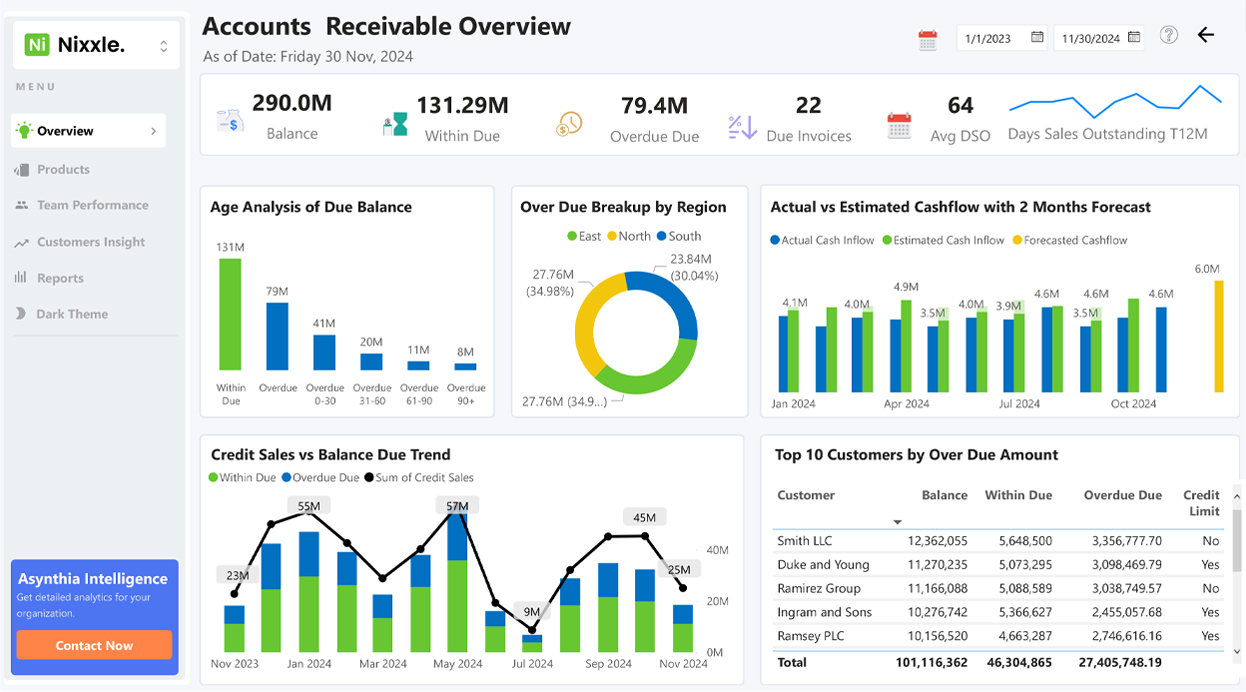
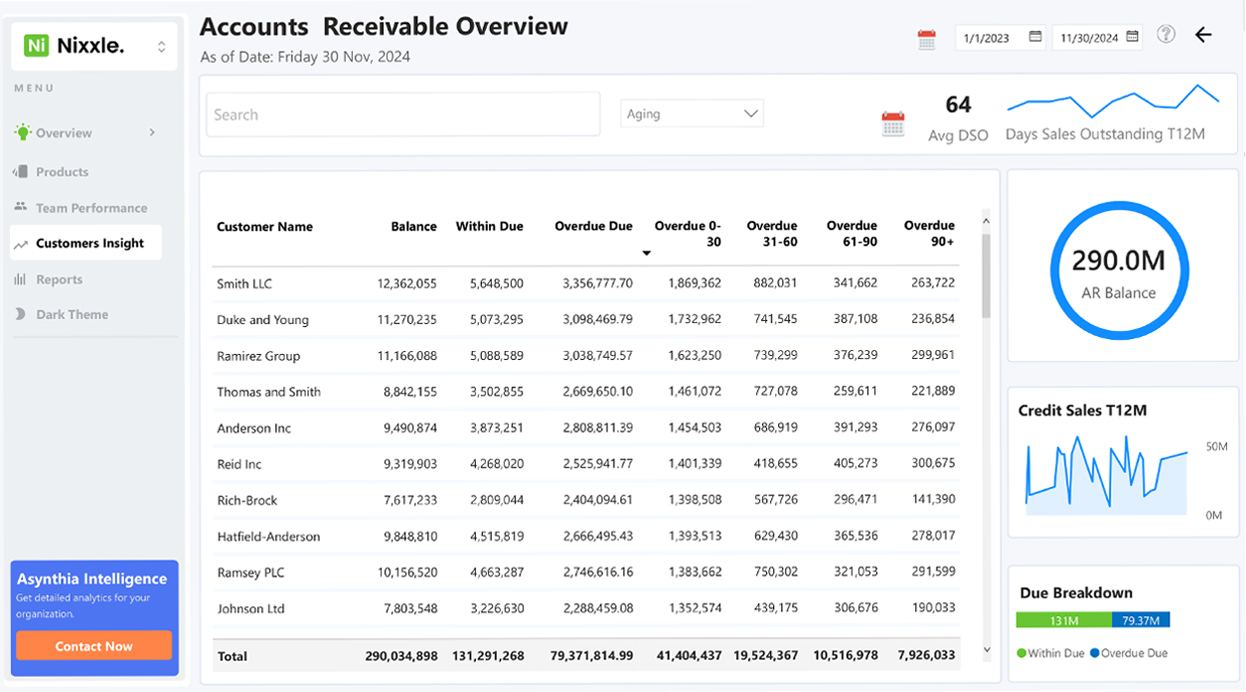
The primary objective of this project was to create a visually appealing and user-friendly dashboard that provides a comprehensive overview of receivable aging insight; due balance, overdue aging, overdue by group, and top customers overdue balance. The dashboard aimed to empower receivable analyst, the management to make informed decisions to reduced AR days, boost revenue growth, and improve overall cash flow management.
Step 1: Data Collection and Preparation
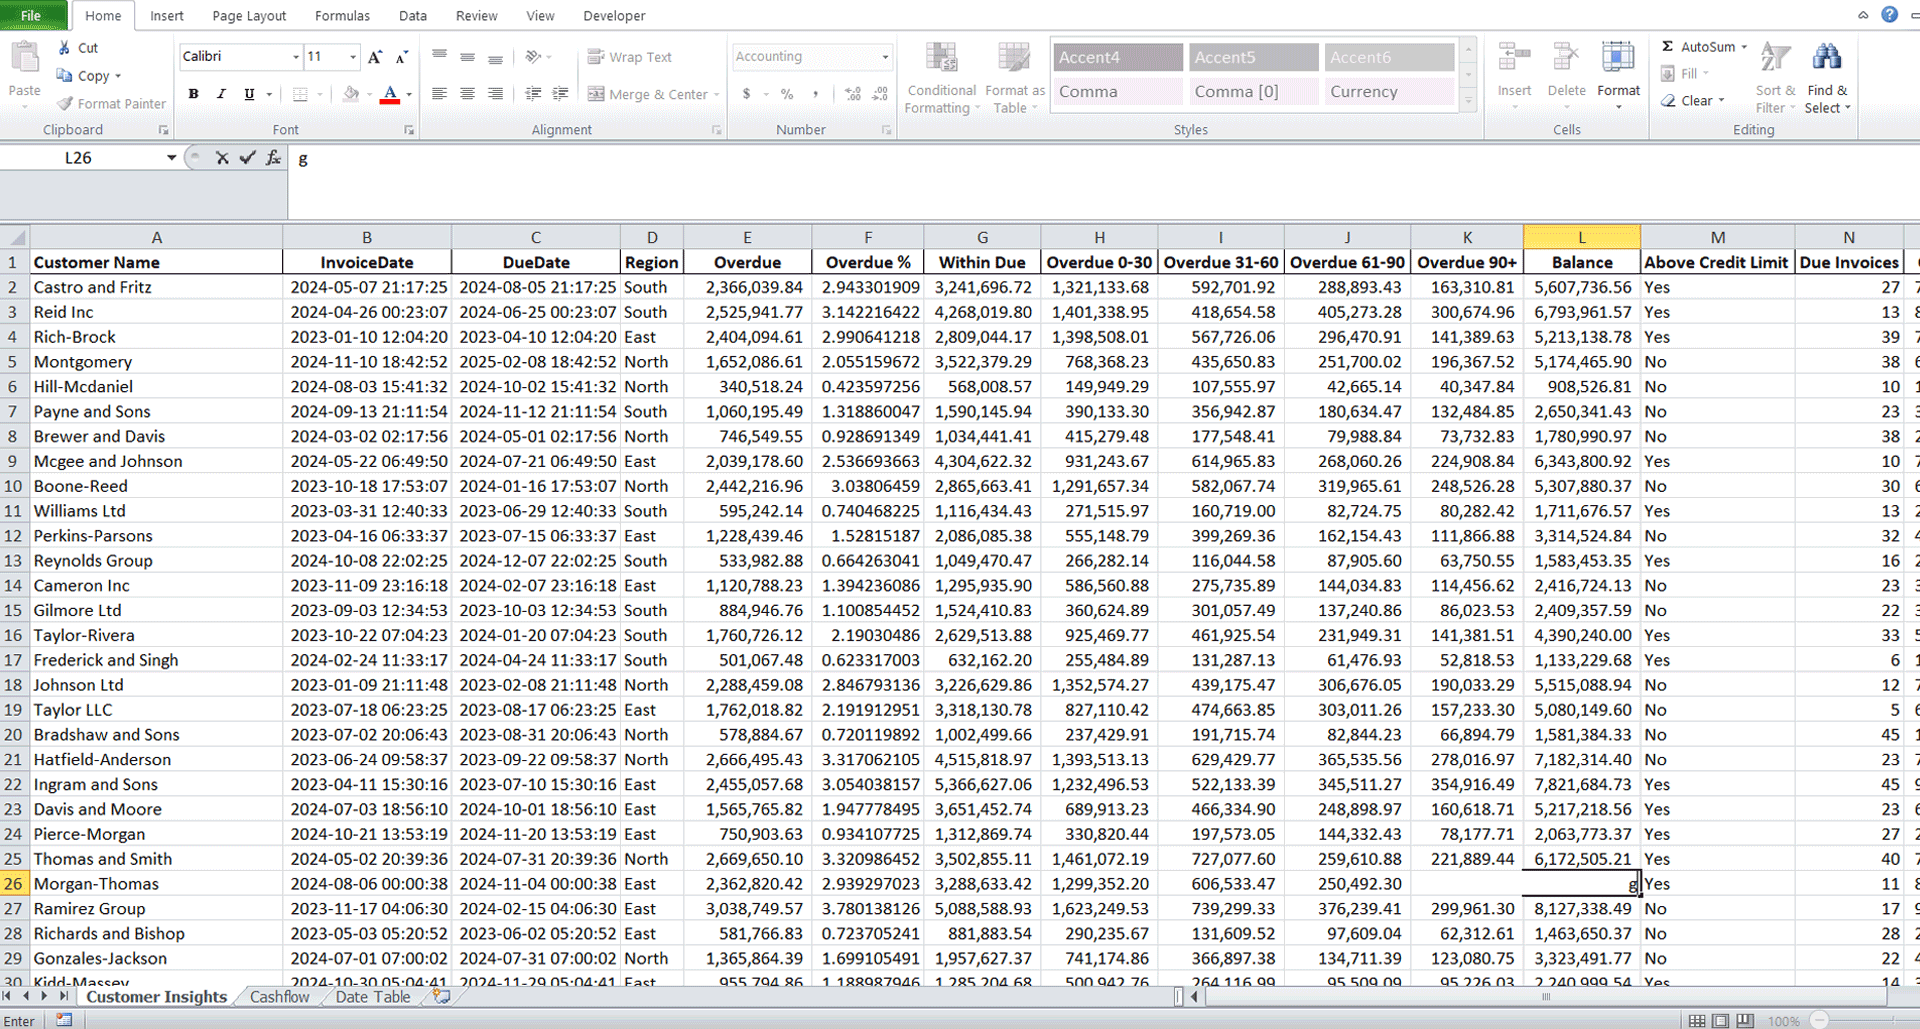
- The first step in designing the dashboard was to collect and prepare the receivables data. However, I faced a unique challenge: all the data was synthetically generated. This required a significant amount of prompt engineering to get the exact data I needed to work with. Thankfully, with the help of ChatGPT, I was able to overcome this hurdle.
Step 2: Data Modelling
- Next, I created a data model to define the relationships between the different tables in the dataset. I created a star schema with the customer table at the center.
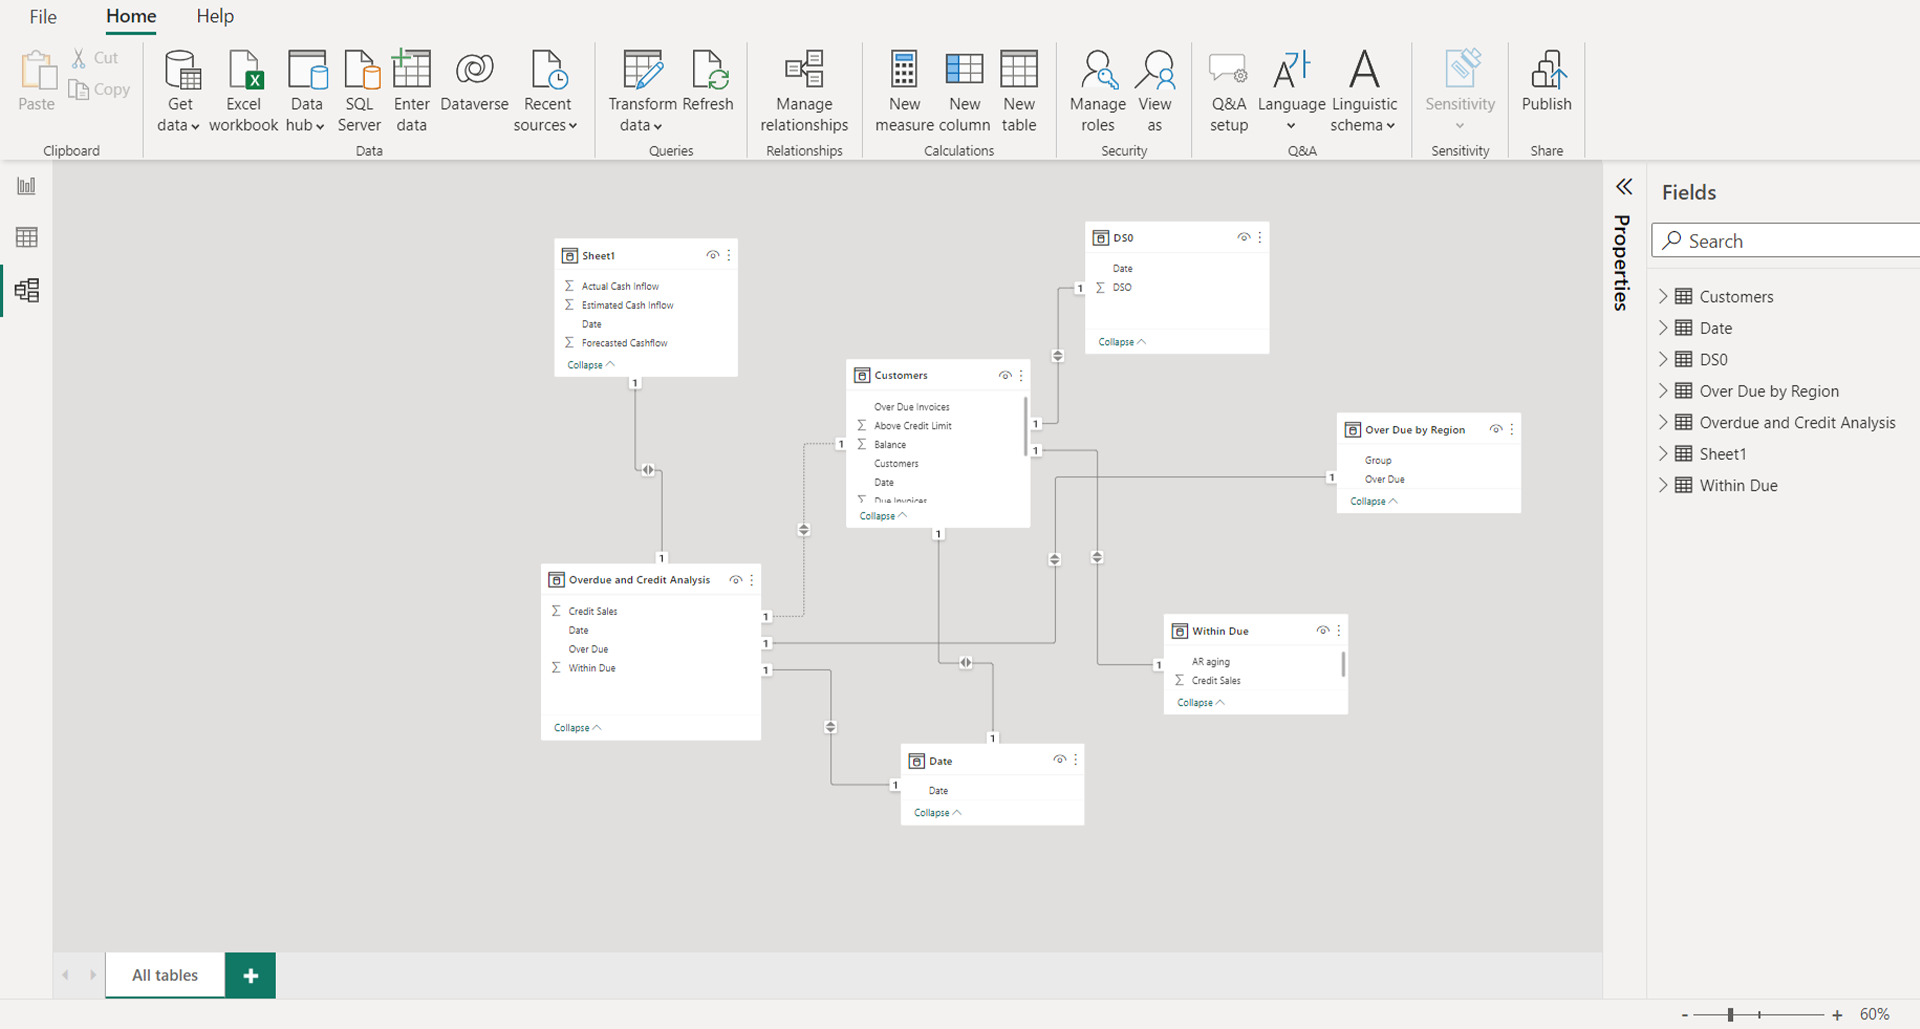
- Defined measures and calculations: I utilized Data Analysis Expressions (DAX) and Power BI Unpivolt Column to define key measures and calculations such as; overdue, overdue 0-30, overdue 31-60, overdue 61-90. This step facilitated dynamic calculations and interactivity within the dashboard.

Step 3: Dashboard Design
- The dashboard consisted of several pages, each focusing on a specific aspect of receivables management:
- Overviews: Provided a high-level summary of receivables data, including total receivables, overdue amounts, and top customers.
- Customer Insights: Provided insights into customer behavior, including payment patterns, credit limits, and overdue amounts
Step 4: Interactivity and Navigation
I also added interactive elements, such as filters, slicers, and drill-down capabilities, to enable users to explore the data in more details.
Conclusion
Creating a comprehensive receivable management dashboard showcases my expertise in data analysis, visualization, and dashboard design. By following a systematic approach from generating synthetic data through ChatGPT, to data transformation and refinement, I have demonstrated my ability to transform complex data information into a user-friendly and visually appealing tool. This project exemplifies my commitment to delivering actionable insights and driving informed decision-making through data-driven solutions.